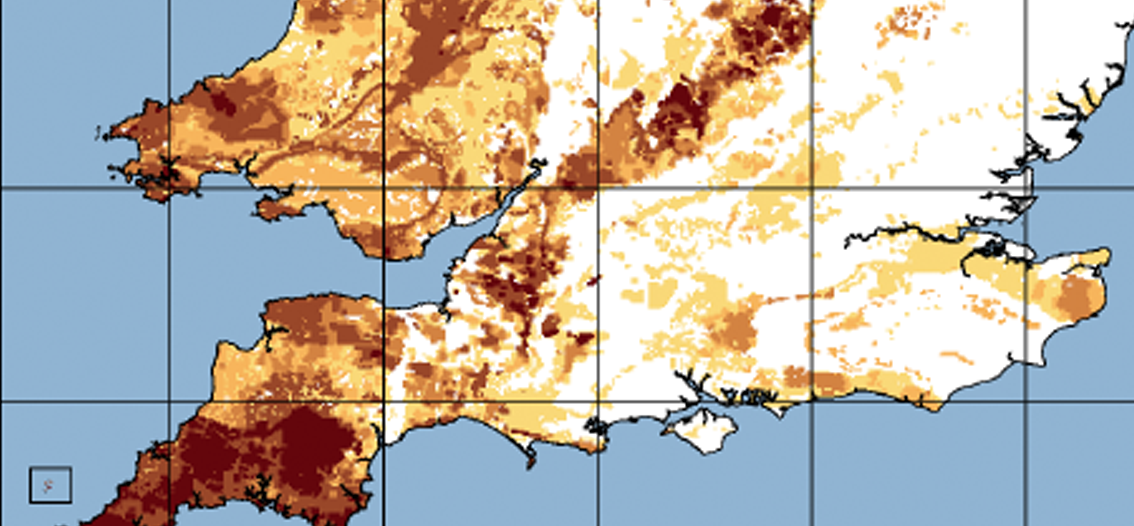
DARKER MEANS DANGER
The PHE and British Geological Society have produced a set of national maps that give an indication of the areas that have a higher radon potential. The darker the area, the higher the potential. However, the only way to be really sure is to perform a postcode assessment. Radon Action experts are ready to assist you – it all starts with a free initial assessment.
IT ALL COMES DOWN TO PERCENTAGES
Certain areas of the country are more prone to radon than others. To tackle this, the Health Protection Agency (HPA) proposed a control strategy creating a radon ‘Action Level’ in affected areas. When radon reaches a certain concentration, action must be taken to reduce it. The percentages you see below shows the radon potential risk percentage. The higher the number, the greater the risk from radon over-exposure.
0%+
+30% radon potential risk percentage
0%
10-30% potential risk percentage
0%
5-10% potential risk percentage
0%
3-5% potential risk percentage
0%
1-3% potential risk percentage
0%
0-1% potential risk percentage
ENGLAND & WALES
SCOTLAND
NORTHERN IRELAND